
StrategyBlocks new Features Release – February
New Fully Customizable Metrics Object
Last year we added a new View Type for the Custom Dashboard Block Object. It provides the ability to use HTML to create your own highly customized dashboard objects, when you need to create something that is not available from the existing view types. It offers the ultimate flexibility for displaying information concerning work management output; that is, the progress achieved against deliverables.
We have now taken this concept and applied it to metrics. Metrics are those structured values that help us monitor the key business outcomes (KPI’s), and can be linked to any of the deliverables described in the strategic plan.
There are a wide range of metrics attributes that can be configured to create exactly what you need, including:
- Title, Description, Focus Area, Owner, and Manager
- Actual/Target: Capture a value from any date in the series so you can compare the actual from last month to today. An optional date expression allow you to define a relative date: last month’s actual = :actual:months:-1
- Status/Color: Display the status of the metric in text or RGB-color form on a specific date. (<label style=”color: [:color:months:-1]”>Status color 1 month ago</label>)
- Date: Allows you to display a date using the same expressions as in actual/targets.
- Title, Description and Focus Area category
- The Owner and Manager of the metric
- Its Actual and Target values, at the start or end of a day, week, month, quarter, or year from a selected period
- The date from when the piece of data was gathered
- The status and color of the metric: good, warning or bad
- The unit of measure
- The tolerance, which is used to define the good, warning or bad zones
- And any supporting data collected in custom fields.
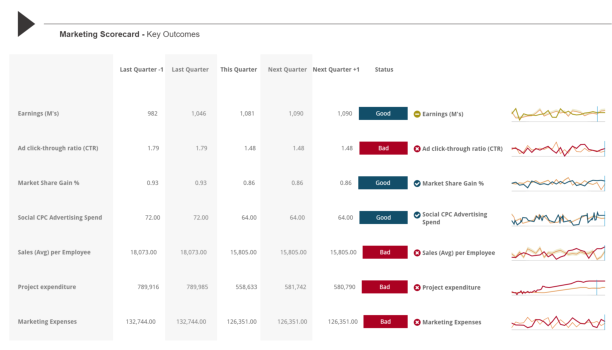
Almost anything can be created, the scorecard above shows a metrics value rolling across 5 quarters, and then uses the sparkline object to show an historic trend.
To find the Metric HTML Layout view type first open the right-hand options menu, drag a metric object onto your custom dashboard canvas, and double click the object to edit its properties. Using the View Type dropdown menu select HTML layout.
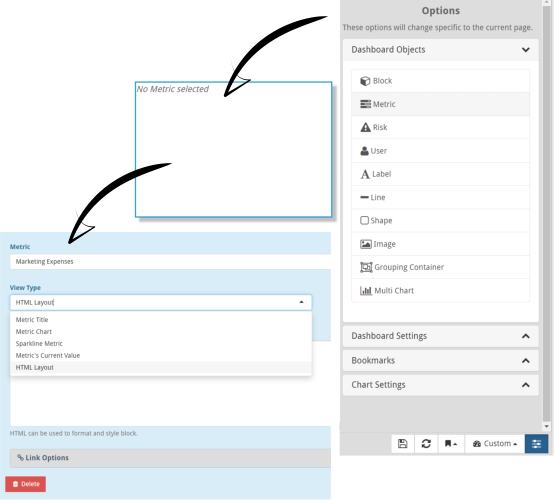
The Options tab shows a list of labels that can be embedded into your HTML, each with corresponding instructions for use. Use the HTML tab to build up your script. To get started try experimenting by copying the label fields from the Options tab eg. [:title], [:description] etc, into the HTML tab and see what happens, and remember to use the preview window at the bottom of the page to see what you have created.
The StrategyBlocks Custom Dashboard is a snap to grid, ready to share or print, customizable reporting tool. You can create dashboards that bring together subjective delivery data, structured metrics, risks and commentary. And of course like the rest of StrategyBlocks you are viewing execution performance as it happens, not in the past.
Leave A Comment