FAQ
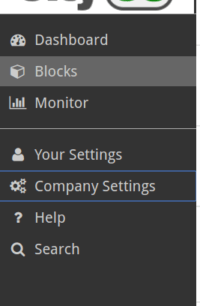
Go to the company settings section:
Click on LEVELS:
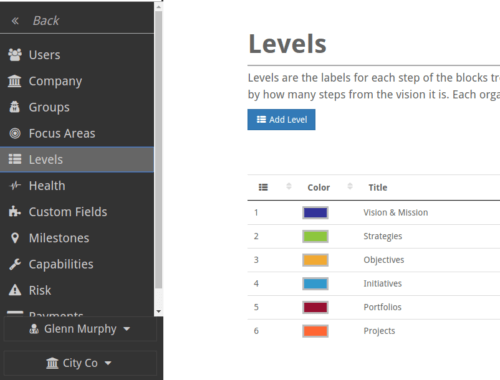
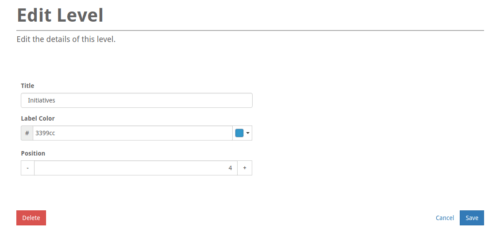
Select the label you want to change and edit it on the form:
Sometimes an activity described by a block in StrategyBlocks carries greater importance to the organization than another, regardless of its position and level in the value tree. There are different ways of thinking about prioritization and the effect is has on blocks and output.
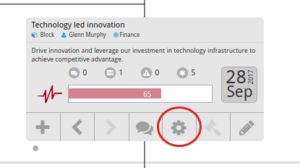
The priority field [BLOCK PROPERTIES (gear icon) > DETAILS > PRIORITY] is used to describe the importance of a block with a numeric value from 1 to 10 (1 = low importance, 10 = high).
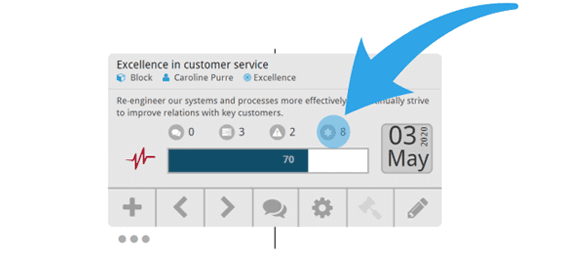
This is a useful visual indicator, but it also has another important role in the blocks customizable health calculation. Blocks with a higher priority will carry additional weighting, meaning it will be harder for its strategic health to outperform its sibling blocks.
However another way of interpreting priority is the effort required to deliver an activity. If a project required double the amount of resource than another (or carried greater importance), it may be desirable to allow for this in the blocks progress rollup [BLOCK PROPERTIES (gear icon) > MANAGE > ROLLUP].
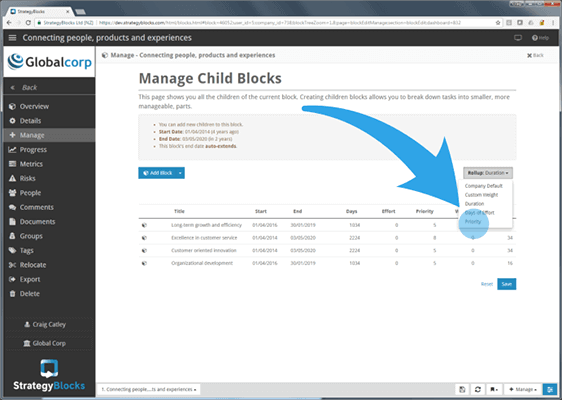
Here we can use the blocks priority to influence its impact on its parent block’s progress. Effectively it will be harder for that block to achieve a positive progress rating because of the importance of 1 or more of its children.
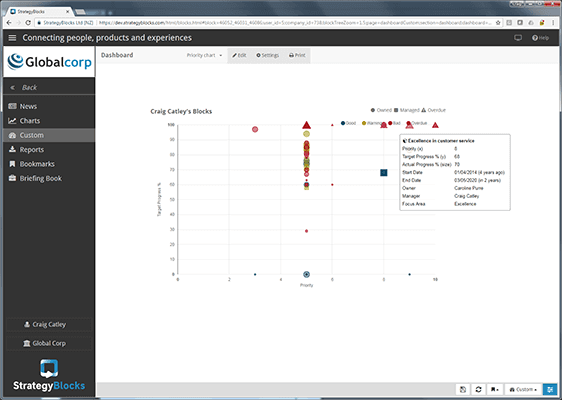
Priority can also be charted within a Custom Dashboard. Priority along with 2 other numeric variables can be charted to plot blocks for the purpose of comparison. An example may be to “show all blocks belonging to a user ranked by priority compared to the actual progress completed to date, with the size of the bubble governed by a third variable” (again priority could be used).
In the previous tutorial How to create a SCORE metric we showed how you can create an effective SCORE calculation on a metric. However, there is limited value in creating a score on a single metric since we already report the status of every metric by default. The score method is best used as a factor in more advanced calculations. In this tutorial, we’ll show how you can bubble a bad status score to the top of your blocks tree, maximising the visibility of problem areas so they can be acted upon quickly.
First, we need to start with a cascading metric. In this example we have a metric called Expenses. Here’s a table where all the leaf blocks are displayed with their expenses metric in the Single Metric column:
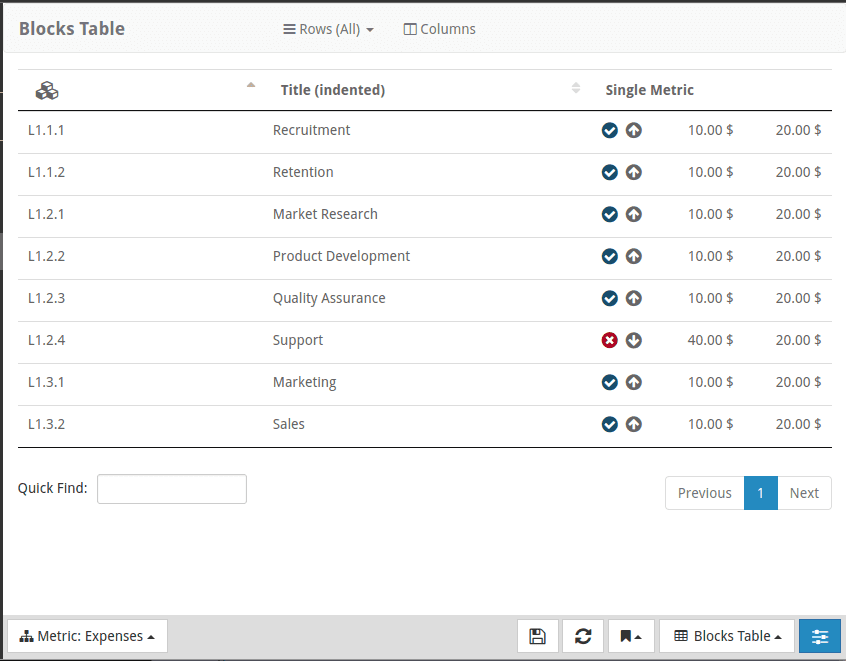
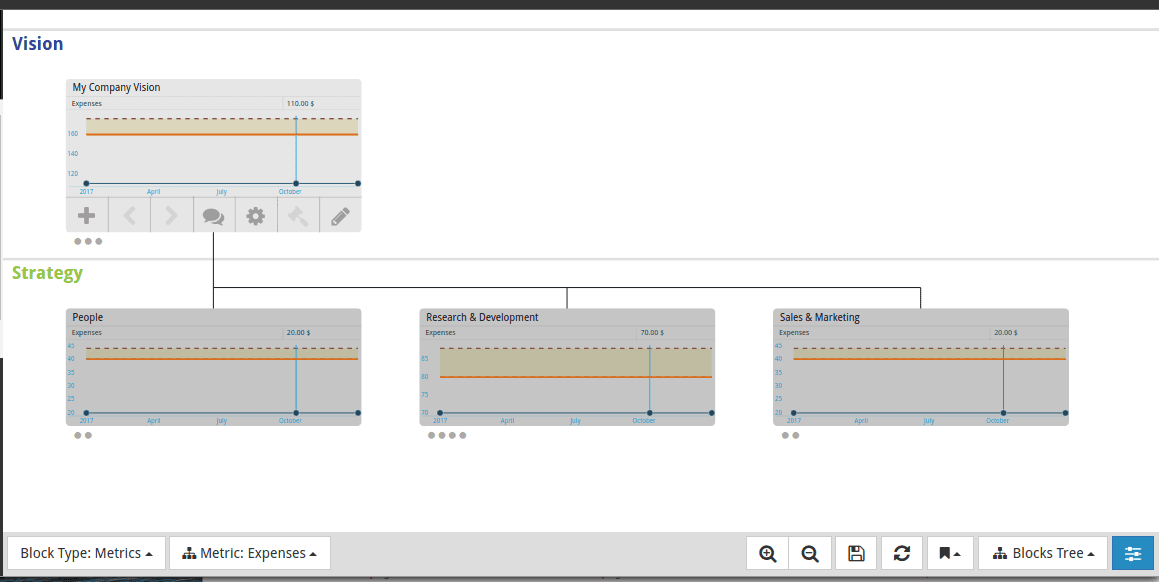
This example is contrived to clearly illustrate the problem and solution. Every block has expenses of $10 and a target of $20, except for the Support block, which has expenses of $40 and the same $20 target. The Bad status shows up easily in this table, but what happens when we remove the filters and look at the blocks tree? Everything looks really good! Expenses are well below targets:
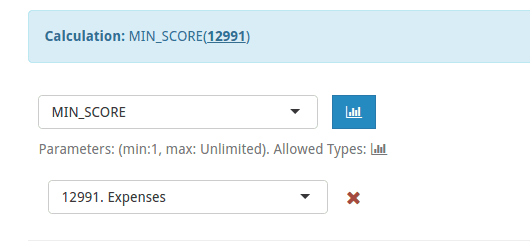
Sure the overall numbers are good, but you don’t want a particular department’s overspending to become a problem later on down the line, so you want to tackle these issues immediately when they come up. Let’s create a MIN_SCORE cascading metric. The calculations are pretty much the same as the first SCORE example, except we’ll use the MIN_SCORE this time. Here’s the Actuals:
And the Target calculation can be exactly the same as before. (As a reminder, this formula just assures us we’re using the same dates as the Actuals series):
Now lets see what this looks like in the blocks tree. Our new metric is called “Find Bad Expenses” and if we display it in the tree:
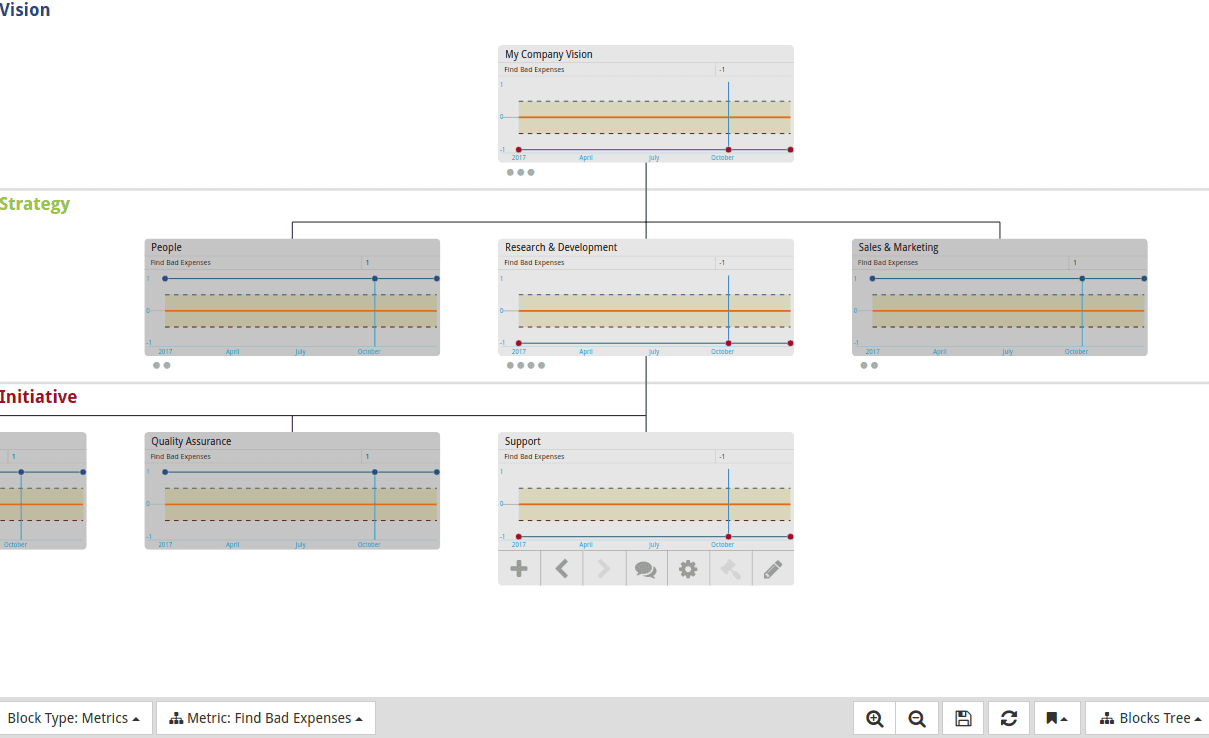
Now we have a series of Bad blocks from the Support block all the way up to the company vision block. This allows someone to go from the root block and easily drill down to any problems blocks as they appear.
Note: The instruction below is reliant on metrics currently existing within your company to calculate the score on.
Create a new Metric
Go to Monitor -> Metrics. Click the New button.
Change your Tolerance Settings
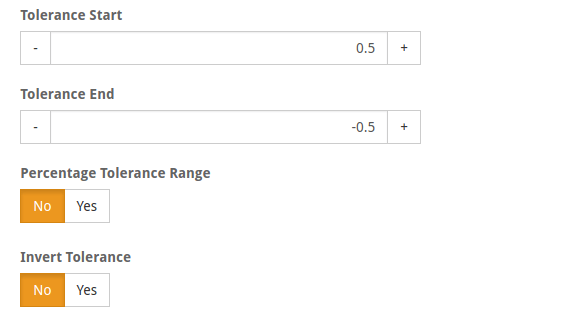
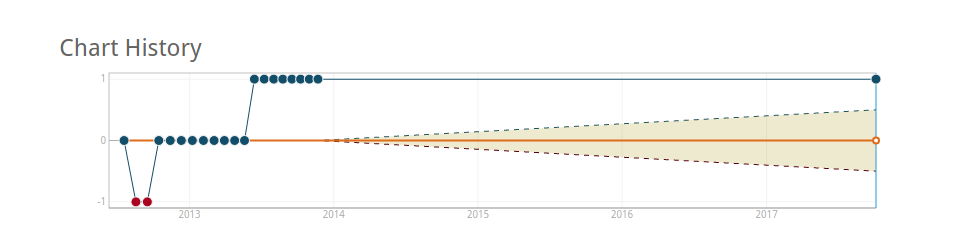
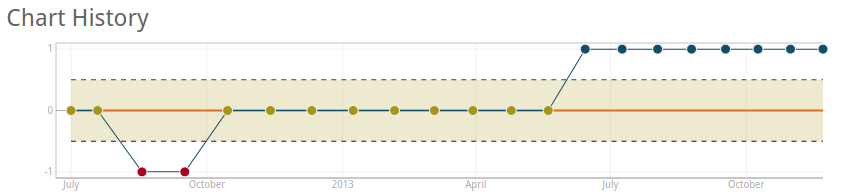
With SCORE, we will only have values in the set [1, 0, -1]. The tolerance (yellow) range is the range between the start and the end, but it does not include the values themselves. So if we set the Start/End values both to 0, you would never have any “Warning” points. If you set Start / End to 1 / -1 you would have the warning region filling most of the chart. A way to balance this on the chart is to go halfway: 0.5, -0.5, which results in a chart that looks like this:

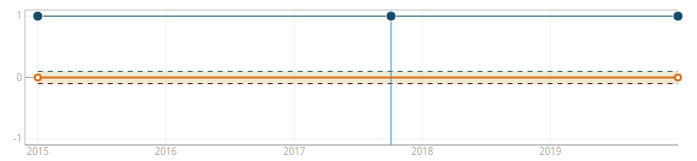
So you can decide how you want to fill that range.
Now you may save your metric.
Create your SCORE calculation for your ACTUALS
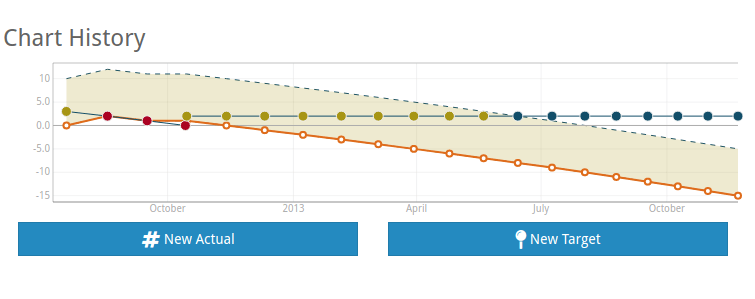
This metric started off badly, but the target has diminished over time resulting in an upward trend into the “Good” range. Let’s create an actual calculation based on this metric. Go to your new metric’s “Actuals” menu, You should see an option to add Manual Actuals or create a calculation:
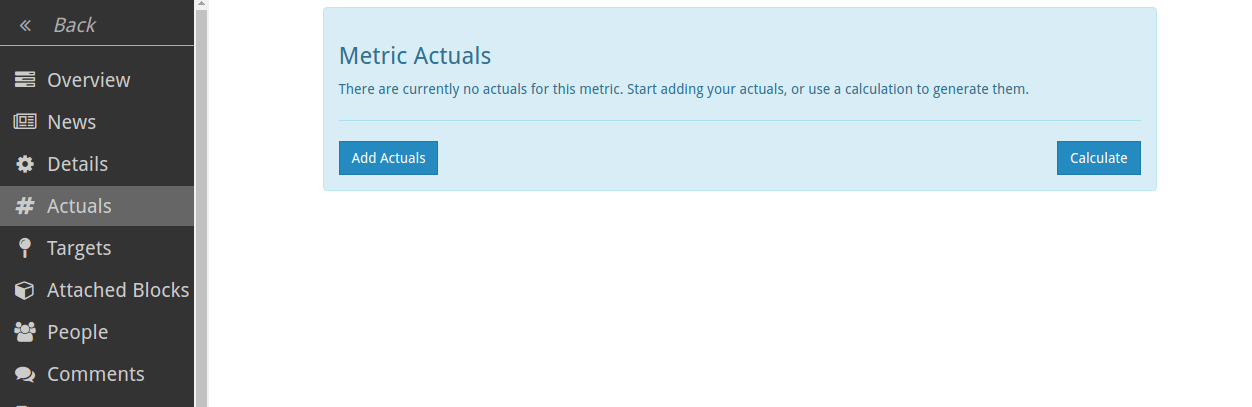
Click on the Calculate button to start the calculation editor:
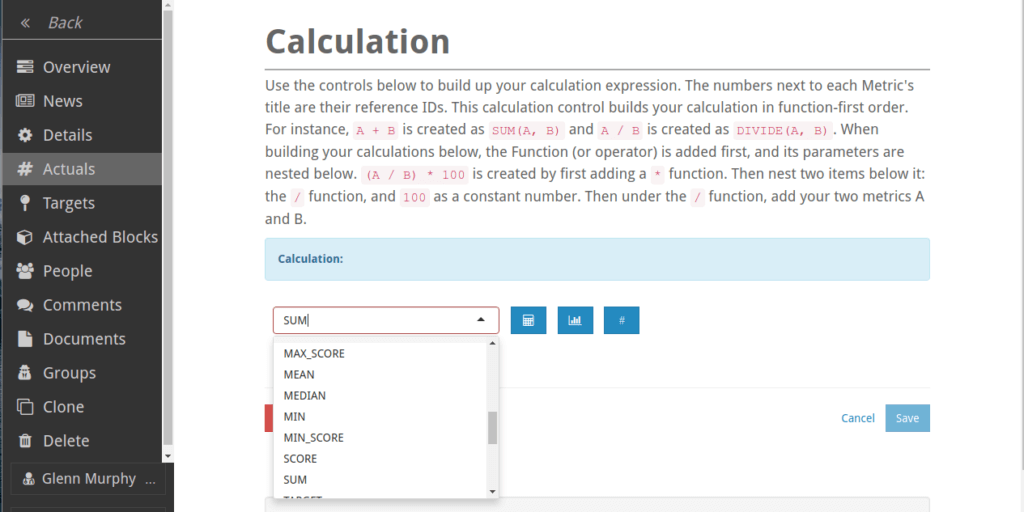
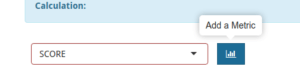
Select SCORE from the list of available functions. Then select the blue button next to it to add a Metric. The SCORE function only takes a single metric, so the other options are hidden at this point:
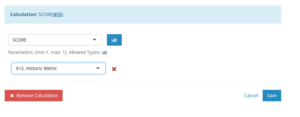
I’ve picked the historic data metric, and now have a valid calculation. Press Save.
Next we want to tweak our target so that it’s always 0, which forces the tolerance we created before to mark -1 values as BAD(red) and +1 values and GOOD(blue) and 0 values as WARNING(yellow). There’s many ways to do this. The first is to not enter any Targets, which gives us this because it’s historic and there are no historic targets:
Since our first value is in 2012, let’s add a 0 there and see what happens:
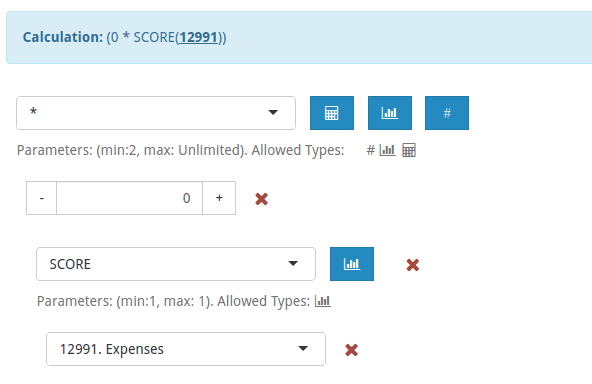
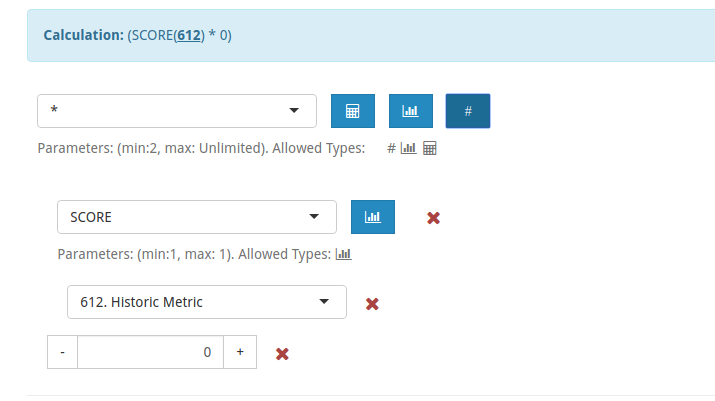
That works, somewhat. Since we’re basing this on a calculation, if anything changes to the source data we many need to tweak the target. For instance if they remove the 2012 data from the source metric, we’ll have a dangling target to change. The most reliable option is to make the target another calculation that always resolves to 0. There are many ways to do this, but the most reliable is to make the same calculation as the Actuals, but then multiple the result by 0. Here’s what that looks like under the target menu:
The reason this works best is that it aligns itself with all the same values that appear in the metrics series. This means you don’t get dangling future / past values showing up where you don’t want them, and it’s fully dynamic based on the source metric.
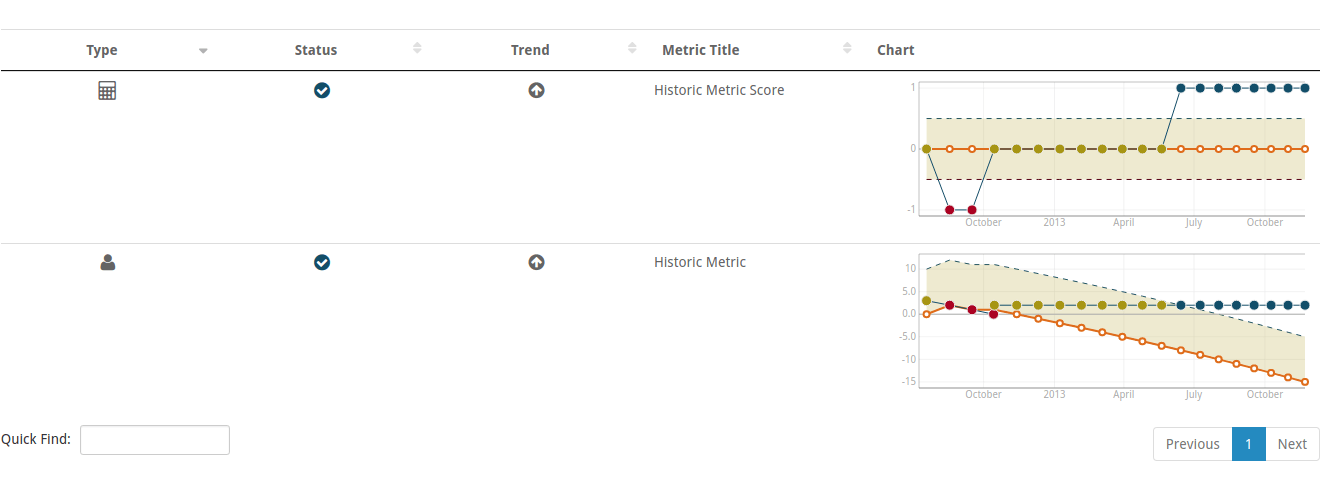
Now you can compare your two metrics in the table view and their x-axis lines up perfectly:
Customize the timeline view
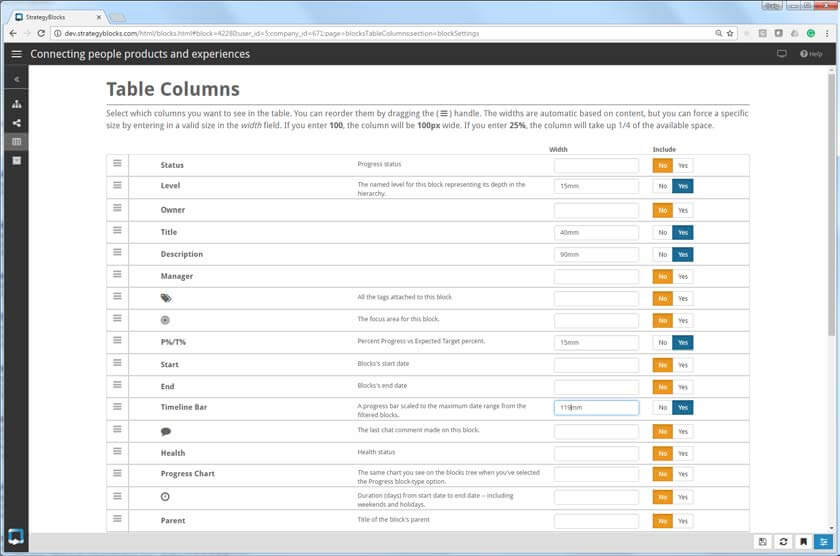
Click BLOCKS TABLE > COLUMNS
Using the example that we want to output to a US letter paper size in landscape layout, these are example column widths (NB: dependant of course on the displayed columns).
Scroll to the bottom of the screen to SAVE.
Filter and save the view
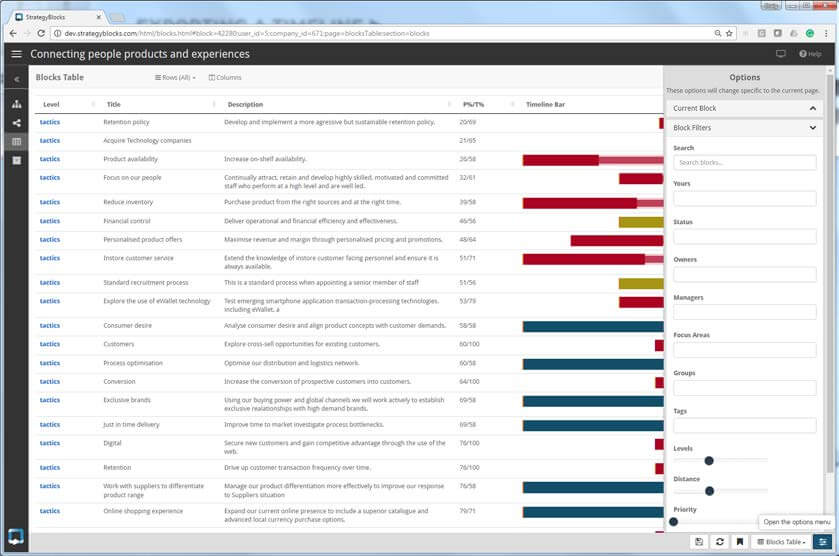
Open the right OPTIONS MENU and using the LEVELS filter controls, drag to include only the level you wish to display (in this case level 4 “tactics”).
You will now have a custom table view, in this example the Timeline Barcolumn has been sorted to rank those poorly performing blocks first.
Use the BOOKMARK button to save this view for future use.
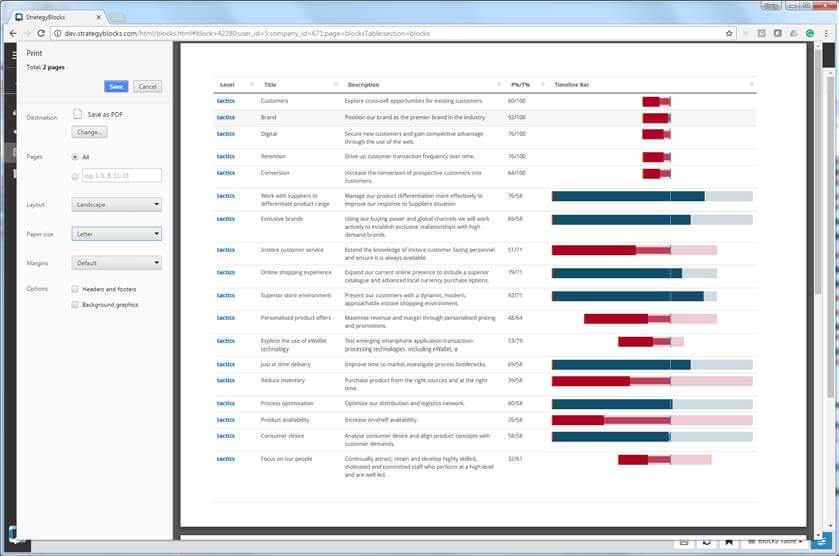
Print or save as PDF
From the browser, select PRINT (or CNTR-P), select paper size LETTER and layout LANDSCAPE.
Select PDF to export as a PDF file.
For technical issues and how-to guidance, contact our friendly Support Team – help@strategyblocks.com
Clients are welcome to contact our team of Client Advocates at any time. Client Advocates will keep you up to date with new features, product updates, arrange any required training and keep you up to date with strategy execution information. Contact the team at – clientadvocate@strategyblocks.com
StrategyBlocks supports the upload of information to support the execution of any block (key result area), metric (key performance indicator) and risk contained in the strategic plan. This includes:
- External Links (URL’s)
- Upload of files – images, documents, files etc
- Attachment of Google Drive files – including search etc
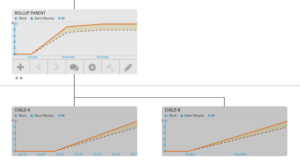
Let’s see this example. The orange line is the target which rolls up the same as the progress %, so we can use that for these examples. The blocks below all start Oct 1.
ROLLUP PARENT ends Dec 31.
CHILD A ends Oct 31.
CHILD B end Nov 30.
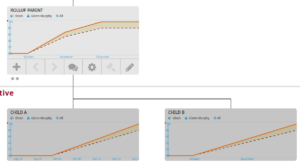
This is the progress chart view in the blocks tree. The lines before October are all 0. Once we hit Oct1, we start expecting progress at a linear rate in the child (e.g., a straight line from 0 to 100% over the duration of the block). The parent’s line is based on the children’s target-lines and the rollup setting. In this case we’re using duration rollup (default rollup).
Child A is 1 month, and Child B is two months, so this means A contributes 1/3 months to the ROLLUP PARENT (P) (33%) and B contributes 2/3 months (66%) to P‘s progress. On Oct 31 we expect 100% of A (33%) and 50% of B (66/2: 33%). This means that P expects 66% on Oct 31. The remaining 33% is required from B on Nov 30. Even though P goes to Dec 31, it’s target is 100% for the all of DEC.
Now let’s see what happens when we change the rollup to “custom weight”. (we would have the same picture as above if we said A had a custom weight of 30 and B was 60, since duration is weighted based on the number of days). Anyway:
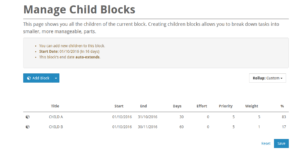
A is 5, and B is 1.
Here’s what the charts look like now:
Child A: now contributes 5 (out of 6), and is due on Oct 31. This means it’s adding 83.3% on Oct 31.
Child B: now contributes 1 (out of 6). On Oct 31, it’s expected to be 50% complete. (1/6: 16.6%, so 8.3% is half that. )
83.3 + 8.3 = 91.6% due on Oct 31.
The remaining 8.3% is due on Nov 30.
Basically all the rollups behave the same way. Duration just means # of days.
On the flat CSV report, how do you calculate the quarter periods and what is the fiscal year format?
You can check the Fiscal Year details under the Company Settings Pages.
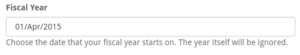
The Quarter Periods are calculated in regards to how the Company Fiscal Year has been set-up.
So if the Fiscal Year is 1 JAN the quarters are calculated in the following way;
Q1: 01/01/YYYY…03/31/YYYY
Q2: 04/01/YYYY…06/30/YYYY
Q3: 07/01/YYYY…09/30/YYYY
Q4: 10/01/YYYY…12/31/YYYY
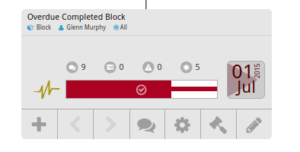
Is there any way to turn those blocks ‘green’?
Is there any way to stop the tail from growing?

When a block is 100%, it can be closed and normally disappears unless the filters have “closed” selected. If it is displayed, it shows as green.
The “tail” is showing the difference between a block’s actual end-date and today (or closed date). The block will remain red until closed because it’s overdue. The end-date and error will both be red as well.
The stars allow managers to rate the success of the strategy once the owner has marked it as 100%. This status can be reviewed at a later date when you’re evaluating how well your plan was executed or when doing performance management for block owners.
To change your email address you will need to log into StrategyBlocks as yourself and then go to Accounts, here you change your Account details including the email address. Click Save. At the moment, an administrator cannot change the email address of a user. If the user is unable to change their email, you can reassign all their objects to a new user and then delete the old user from the company.
A manager is responsible for the details of an object (block, metric, risk,…). This means they can change the titles, description, and so on. The owner of an object is responsible for doing the day-to-day updates. In terms of the blocks structure, the owner of a parent block is automatically the manager of the child blocks. This is because the owner is responsible for updating a block’s progress, and for non-leaf blocks the progress is determined by the children. With metrics, the owner is responsible for updating the actuals, and the manager is responsible for the targets (as well as all the other properties).
StrategyBlocks supports the following browsers:
Chrome X
Firefox X
Safari X
Microsoft Edge X and Internet Explorer X
We support the current major releases of Google Chrome®, Firefox®, Safari®, Microsoft® Edge™, and Internet Explorer®. Each time a new major version is released, we will undertake to support that version, with previous versions progressively becoming unsupported.
StrategyBlocks will always be committed to utilizing the latest functional advancements of the latest browser technology.
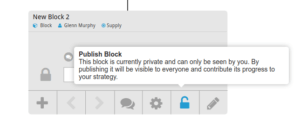
In StrategyBlocks, new blocks are public by default. If you want to make a block private, select the block row on the manage children page to edit it’s details. (Note: you cannot make a public block private, so you’ll need to check this box before you save your newly added blocks.)
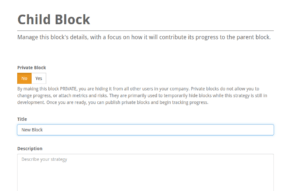
To make a block public, click on the unlock button on the toolbar:
On any of the login pages, select the forgot password button and enter your email address.
After resetting my password I try to log in and get a messaging saying: “This email cannot be found”
It may be that the URL you have is for a different server that you don’t have access to. We have many servers intended for demos or different regions. For instance, Australian clients may be hosted on https://aus.strategyblocks.com. Please check your emails to find out which server you are on, or contact us and we’ll find your information.
Licenses may be purchased within the StrategyBlocks application by going to the Company Settings -> Payments page and using your credit card. You can also contact us directly and we will issue an invoice for your desired number of seats.
Go to Company Settings -> Users. Select the staff member who is leaving. Scroll down to the Reassign Ownership section and click on it:
A new form will appear with options for how you want to transfer their ownership. For instance, you can select different users for their blocks, metrics and risks.
Find your block in the Blocks -> Blocks Tree section. If your block is a leaf block (has no children) and you are the Owner, you should be able to update its progress. Select the edit pencil:
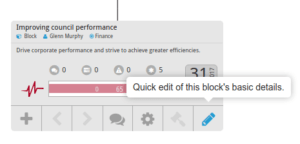
You can drag the progress bar to your % completion amount (e.g., if you’ve done half the work required, it should be set to 50%). The skinnier bar in the background is the current expected target %:
![]()
The progress can also be changed/reviewed by clicking the gear icon on the block and opening the progress page:
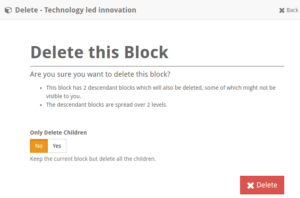
From the blocks tree page, select the gear icon to view the block’s edit pages:
Select the Delete option from the left-hand sidebar menu:
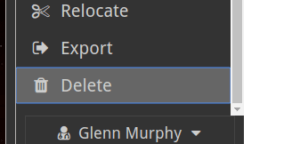
On this page you have the choice to delete the block and its children, or just delete the child and leave the selected-block as-is.