
Note: The instruction below is reliant on metrics currently existing within your company to calculate the score on.
Create a new Metric
Go to Monitor -> Metrics. Click the New button.
Change your Tolerance Settings
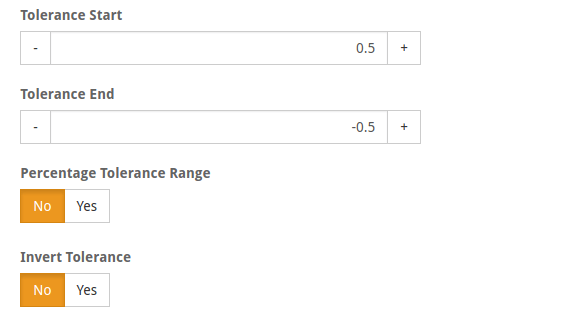
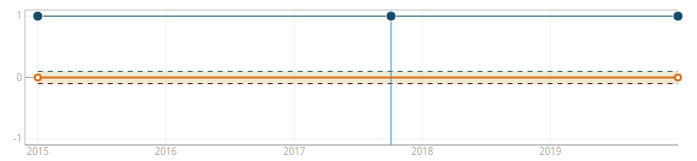
With SCORE, we will only have values in the set [1, 0, -1]. The tolerance (yellow) range is the range between the start and the end, but it does not include the values themselves. So if we set the Start/End values both to 0, you would never have any “Warning” points. If you set Start / End to 1 / -1 you would have the warning region filling most of the chart. A way to balance this on the chart is to go halfway: 0.5, -0.5, which results in a chart that looks like this:

So you can decide how you want to fill that range.
Now you may save your metric.
Create your SCORE calculation for your ACTUALS
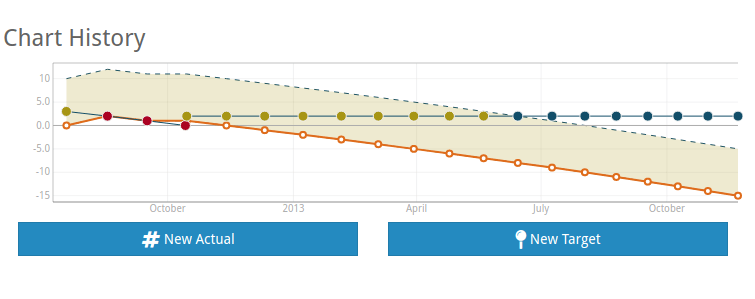
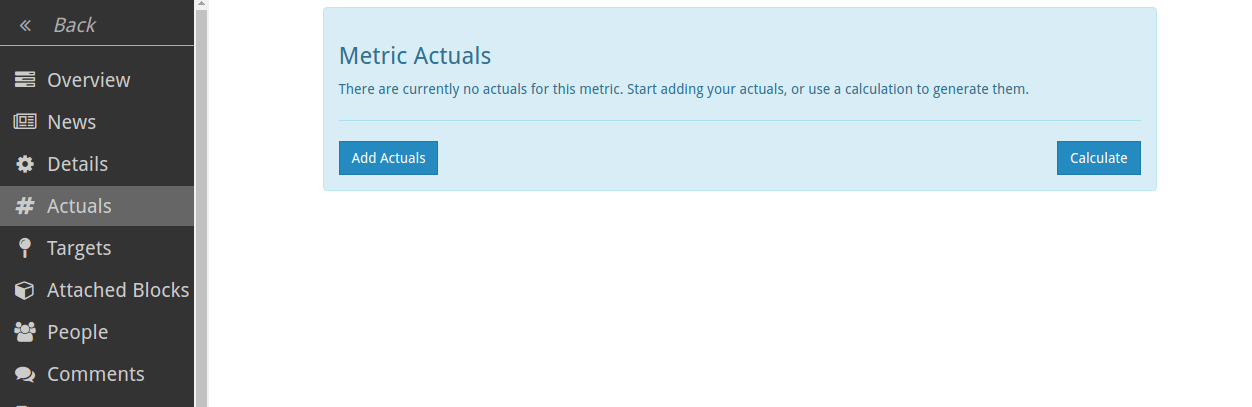
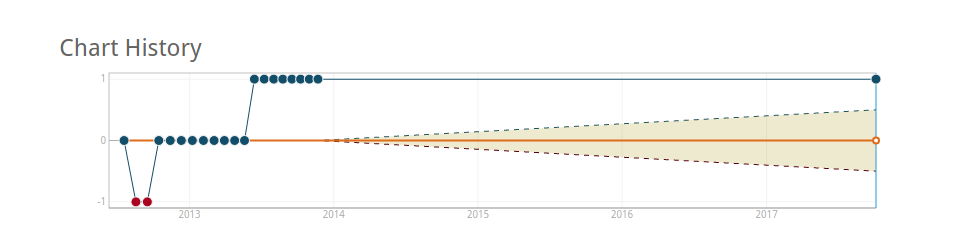
This metric started off badly, but the target has diminished over time resulting in an upward trend into the “Good” range. Let’s create an actual calculation based on this metric. Go to your new metric’s “Actuals” menu, You should see an option to add Manual Actuals or create a calculation:
Click on the Calculate button to start the calculation editor:
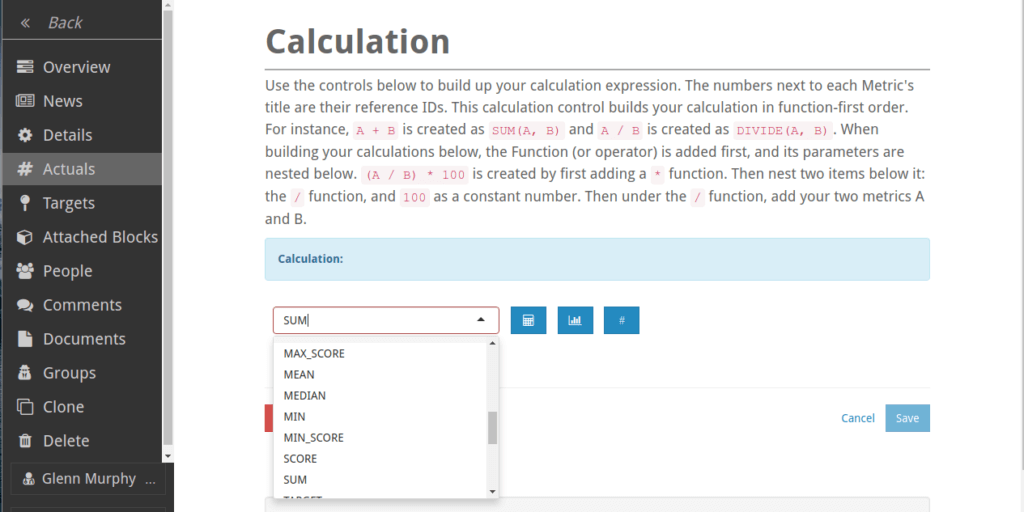
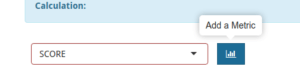
Select SCORE from the list of available functions. Then select the blue button next to it to add a Metric. The SCORE function only takes a single metric, so the other options are hidden at this point:
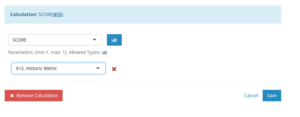
I’ve picked the historic data metric, and now have a valid calculation. Press Save.
Next we want to tweak our target so that it’s always 0, which forces the tolerance we created before to mark -1 values as BAD(red) and +1 values and GOOD(blue) and 0 values as WARNING(yellow). There’s many ways to do this. The first is to not enter any Targets, which gives us this because it’s historic and there are no historic targets:
Since our first value is in 2012, let’s add a 0 there and see what happens:
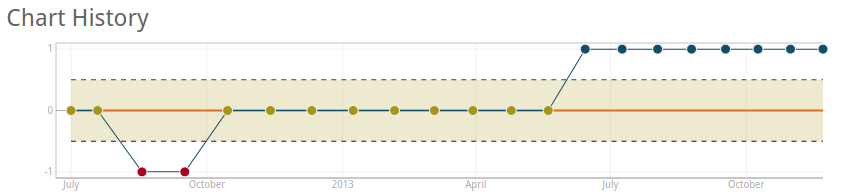
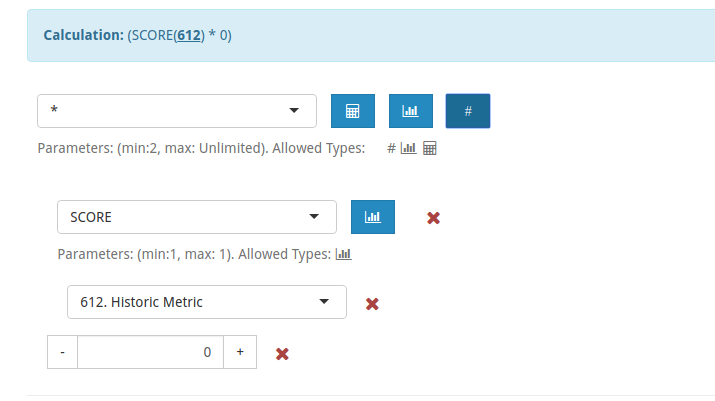
That works, somewhat. Since we’re basing this on a calculation, if anything changes to the source data we many need to tweak the target. For instance if they remove the 2012 data from the source metric, we’ll have a dangling target to change. The most reliable option is to make the target another calculation that always resolves to 0. There are many ways to do this, but the most reliable is to make the same calculation as the Actuals, but then multiple the result by 0. Here’s what that looks like under the target menu:
The reason this works best is that it aligns itself with all the same values that appear in the metrics series. This means you don’t get dangling future / past values showing up where you don’t want them, and it’s fully dynamic based on the source metric.
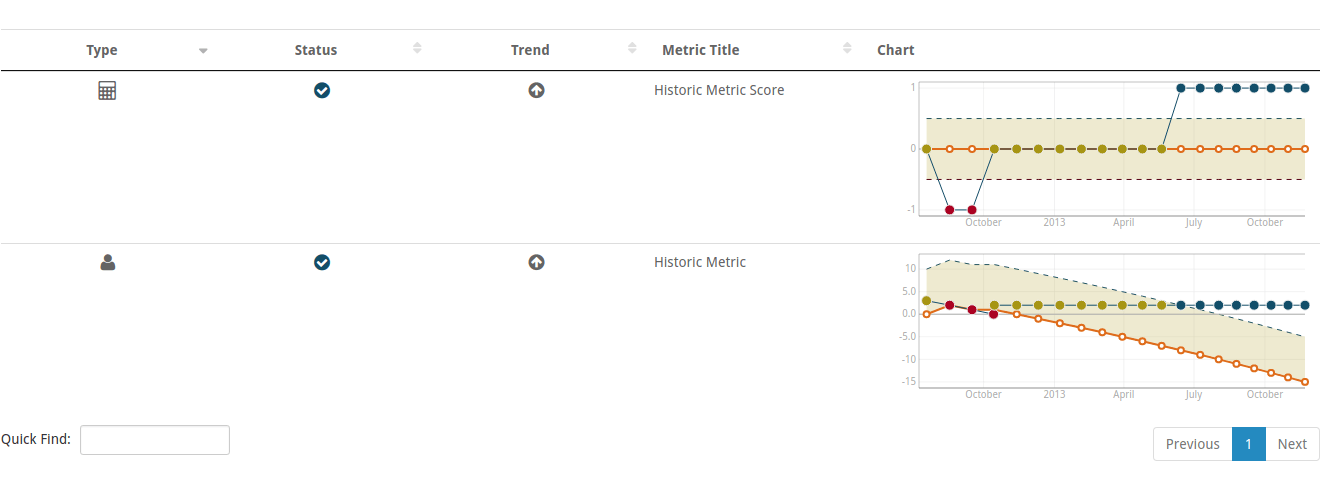
Now you can compare your two metrics in the table view and their x-axis lines up perfectly:
Leave A Comment