
StrategyBlocks Feature Focus – New Dashboard Object Padding & Progress Bar Colors
Dashboard Object Padding
Having a snap-to-grid option for laying out the objects on your dashboards is very helpful, you can arrange everything to line up quickly, easily, and perfectly. However, there are those occasions when you just need to nudge an object ever so slightly to get it into the correct position, perhaps a connector line, a photo, or a logo. So, a new set of fine-tuning controls have been added to the Line, Shape, and Image dashboard objects. To use the new controls, select the object and click the edit button or simply double-click. Expand the Padding Options menu and add a region of white space (the padding) on the top, bottom, left, and/or right. You can use whatever units you prefer (points, pixels, inches, millimetres, em’s etc). The preview window below will help you see the small changes as you enter them.
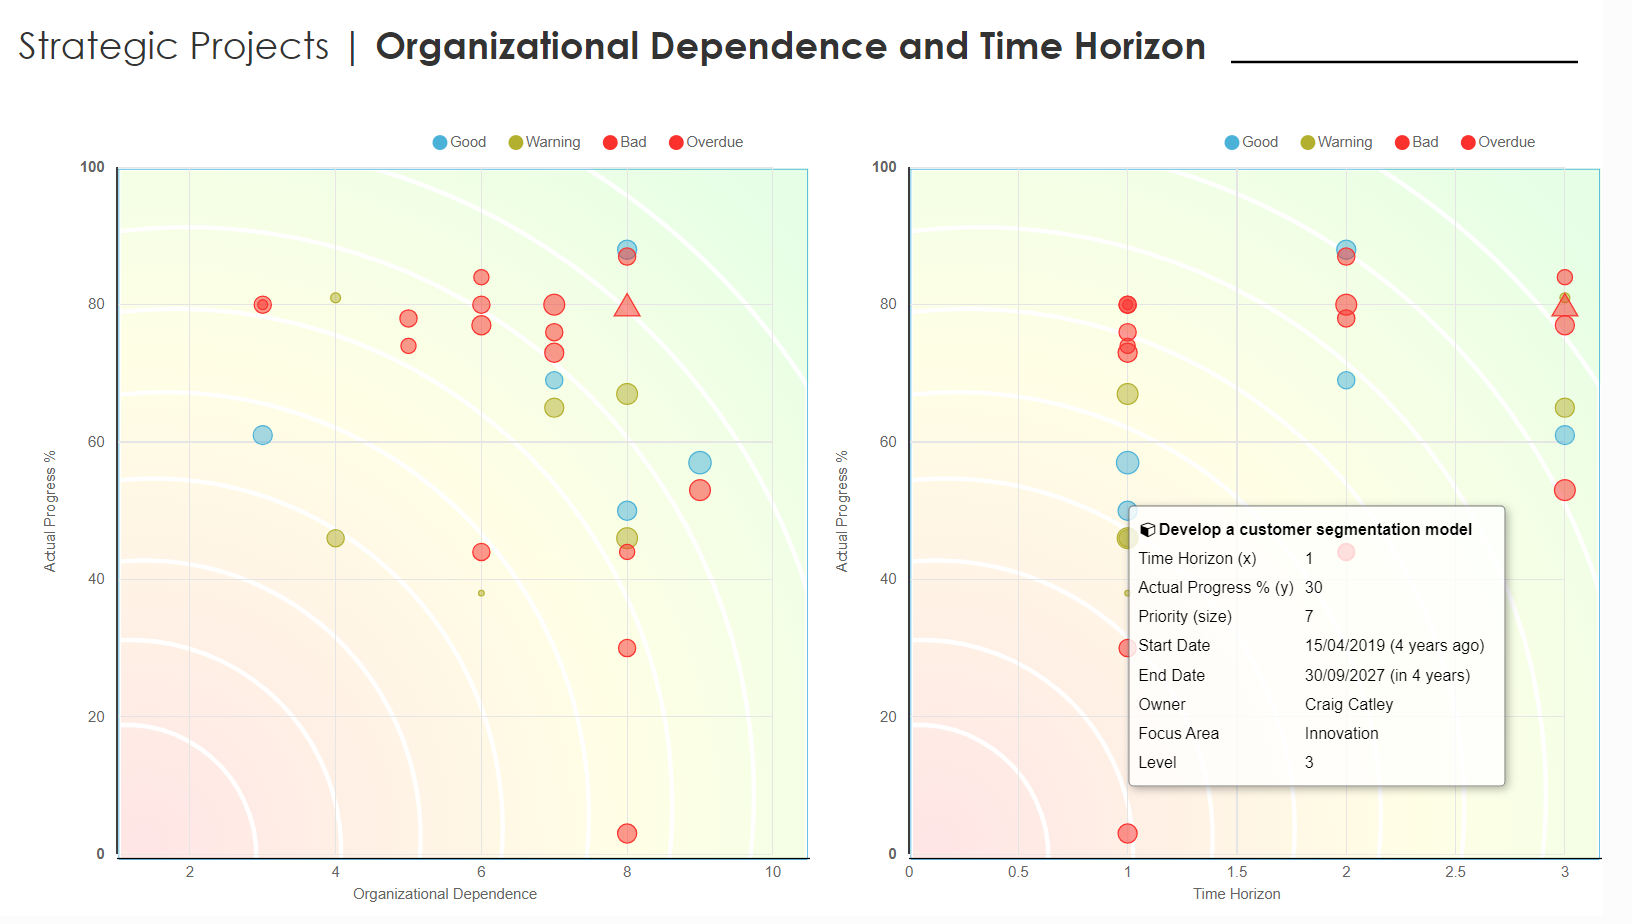
In the example below we can see the new Blocks Bubble chart, plotting the actual delivery progress of all the projects in an organization with two custom fields – the Organizational Dependence on the project and the Time Horizon – to ensure there is an effective spread of projects. A background image has been uploaded to help give the charts context and padding is used to ensure the image aligns perfectly with the x and y-axis.
Dynamic Progress Bar Colors
Work Management is one of the three key variables of successful strategic performance management. While it is a tangible numeric variable, it is also subjective as it measures the level of delivery confidence of an owner of a strategic activity, and as a result, it could move forward as well as backward.
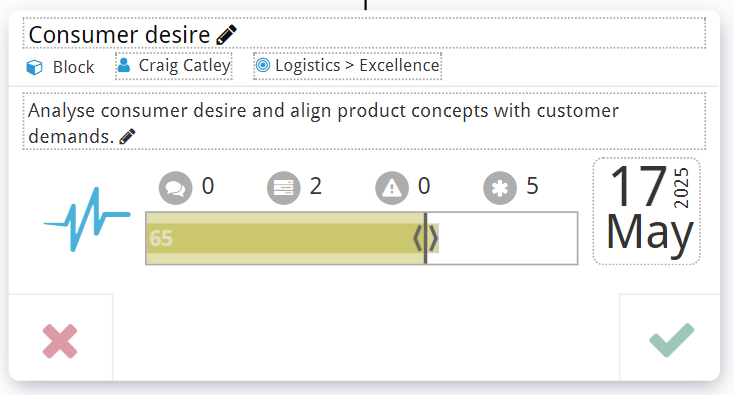
StrategyBlocks describes this as a measure of ‘progress’, and it is represented on several block faces, Overview, Work, Health, and Delivery (as well as a variety of dashboard charts). It is important to understand that only blocks at the very bottom of the Blocks Tree receive progress updates. Progress of all the blocks above is calculated based on these updates, as a result, the strategic plan becomes a dynamic system benefiting from the collaboration of many individuals in real-time. So, we wanted to give the user a real sense of the dynamic nature of adjusting progress, now the progress bar will react by changing color as the update is made, whether progress is behind, ahead of target, or in the calculated warning tolerance zone. Now the block owner will get a sense of how their update is affecting the strategic plan as they drag the progress bar from one position to another. Arrows have also been added to the progress bar recently to emphasize to the block owner that progress can go forward and back.
Leave A Comment