
Strategic Dashboarding and the Use of Imagery
A picture is worth a thousand words
I am a great fan of including imagery as part of my dashboard design and layouts. When used properly, images can add so much to a visualization; however, many would rather fill any spare white space with another number or a pie chart and, as a result, the viewer can become lost in the visual noise of the information presented. The right balance of text and placement of images offers many benefits.
Studies reveal that people find highly visual representations of data that are well-designed and attractive to be more credible, and images can be a key component to achieve this.
Types of images
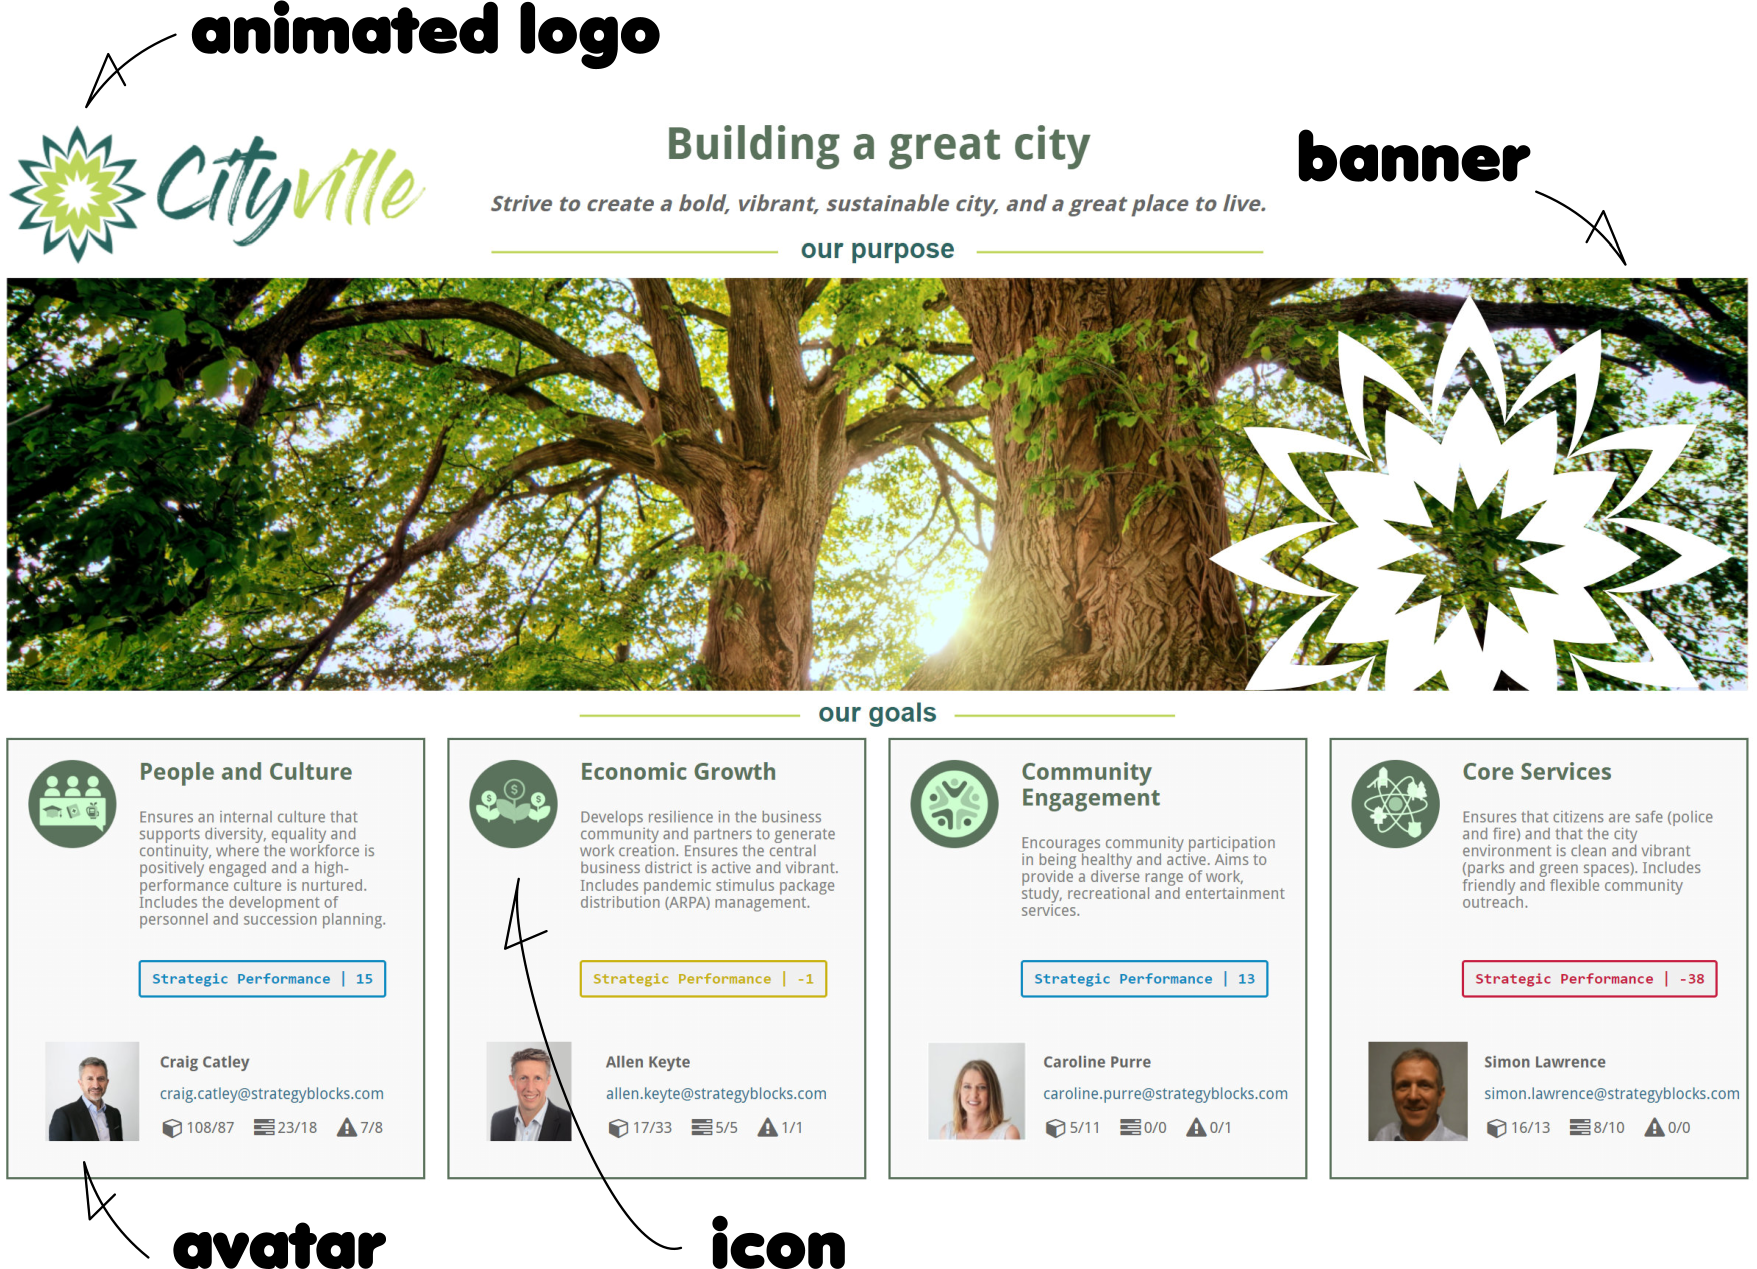
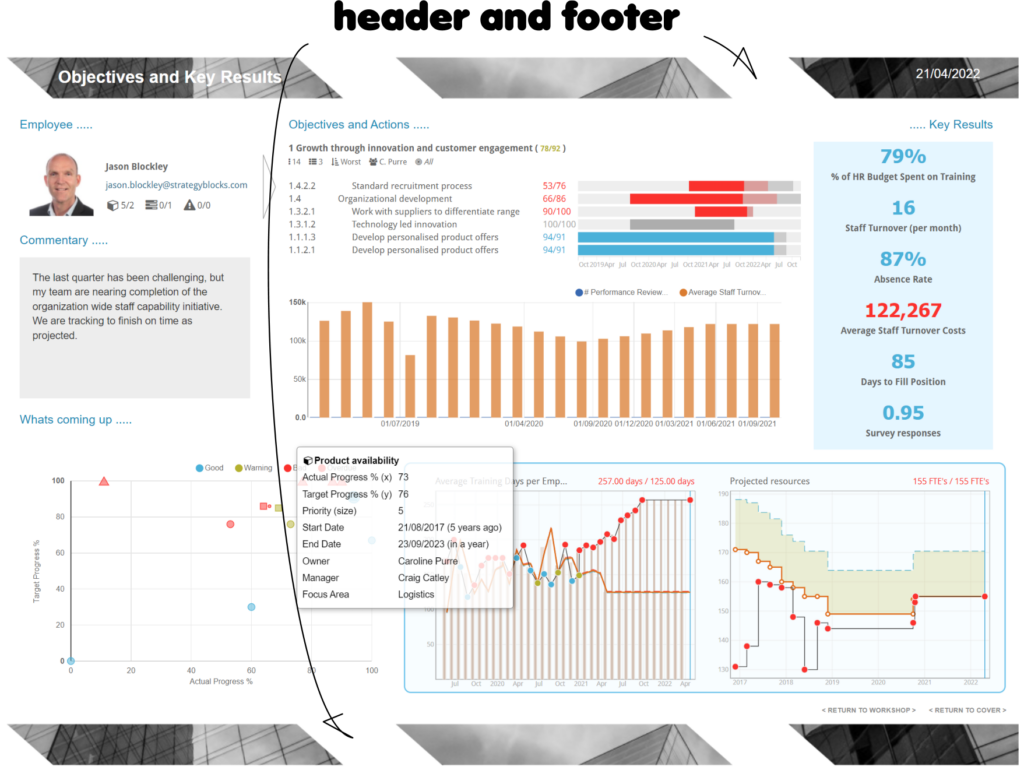
Adding a logo to your dashboard is a great start, but don’t stop there. A background image will lift the overall visual off the page and by adding a header and/or footer banner they will frame the information contained. They can also be used to direct attention and highlight other elements e.g., arrows, icons, frames etc. I would often use button images to guide the viewer along a path to more detailed information that helps tell the story of strategy. The inclusion of photos can give the viewer a sense of community, ownership, and can evoke strong emotional reactions that motivate behavior. A StrategyBlocks dashboard also can include a user’s profile picture which gives the dashboard a personal touch and uses photos to build accountability.
Don’t be limited to only static images–animated GIF’s can bring another dimension to a dashboard layout, and I have occasionally seen clients embed videos in their StrategyBlocks dashboards too!
External dashboards
StrategyBlocks dashboards can now be made available externally to non-system users, and this is another great opportunity to display images: e.g. products, locations, maps, branches etc. It is another way of bringing external stakeholders in and sharing your strategic vision.
Working with images in StrategyBlocks
So how do you get images into your StrategyBlocks Custom Dashboards?
Step 1 – where to upload: go to blocks > block tree and find a block that you own > open block properties > documents (on the left-hand navigation menu).
Step 2 – how to upload: click the +add files button > upload local file > add a title > description (optional) > browse to find the image > hit save.
Step 3 – dashboard placement: with the dashboard in edit mode > drag and drop an image object from the dashboard objects list > double click the objects properties or click the edit object button on the top ribbon > select uploaded document as the image type > from the document list find your image > you can decide if you want the image to appear on all pages or just a specific page > hit save.
Step 4 – linking: if you want the image to link to another dashboard, webpage or object it can be configured from Link Options > hit save.
Step 5 – resize: with the dashboard in edit mode images can be resized by dragging the corners or edges while holding the left mouse button.
Step 6 – reposition: with the dashboard in edit mode images can be moved by dragging from the center while holding the left mouse button
Communication is key
Anything that can help to engage the viewer and encourages communication is of value, just ensure your images are relevant and complementary to the style of the report.
If you would like to book a dashboard workshop with us, please book a time here. Happy dashboarding!
Leave A Comment