
How to Create a Balanced Scorecard Strategy Map
The “Urgent Requirement”
I am sure we can all relate to an urgent request for a report of some description. Given that the primary theme of this month’s newsletter is strategic agility, it was coincidental that a colleague asked me to create a balanced scorecard strategy map in the form of a dashboard–the client was keen to get it back before the end of the business day. There are always other things that need to be done, so “a day” really turned out to be half a day at best. So, I thought it may be useful to describe the steps I took and the duration of each to get a true sense of agile report development with StrategyBlocks. Let’s get started using a City demonstration model:
Step 1 – Describing your BSC Perspectives
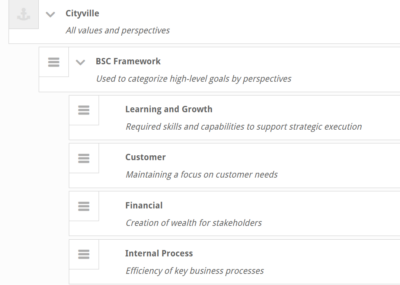
Perspectives are the framework for a balanced scorecard, and StrategyBlocks has a very flexible method of capturing them using our Focus Areas feature. We need to ensure the perspectives (focus areas) clearly describe its purpose in a strategic context for the viewer. Just to recap, here are the perspectives I created:
Learning and Growth | Required skills and capabilities to support strategic execution
Customer | Maintaining a focus on customer needs
Financial | Creation of wealth for stakeholders
Internal Process | The efficiency of key business processes
> Time taken: 15 minutes
Step 2 – Applying your BSC Perspectives
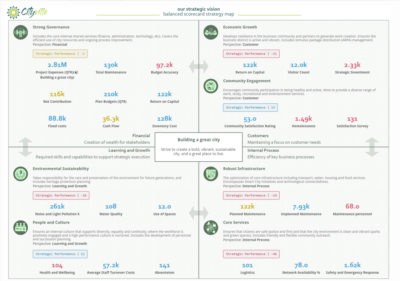
Balanced Scorecard is a powerful methodology, but it is so often solely focused on key performance indicators (KPI’s). In StrategyBlocks we want to add the dimension of strategic delivery (output) confidence alongside those key metrics (outcomes). Our goal is to always create a linkage between activity and success.
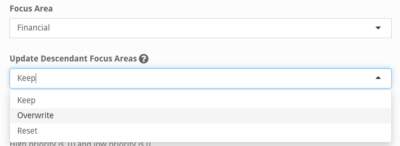
So, I needed to categorize all the high-level goals and metrics that I want to display on my BSC strategy map. Fortunately, I have a useful feature at my disposal called “Descendant Overwrite” which allows me to cascade a Focus Area down through an entire branch of strategy which saves a lot of time.
> Time taken: 10 minutes
Step 3 – Cloning a Dashboard
I always try to maintain a consistent corporate look-and-feel across my dashboards. I want the viewer to identify straight away with what they are looking at and its purpose. I also don’t want the dashboard to look out of place if it is incorporated with other reports in a pack. So, I start by cloning another dashboard which has elements on it that I think I can reuse. I can then set the page size (this report will be printed) and the page orientation.
> Time taken: 2 minutes
Step 4 – Dashboard Design and Structure
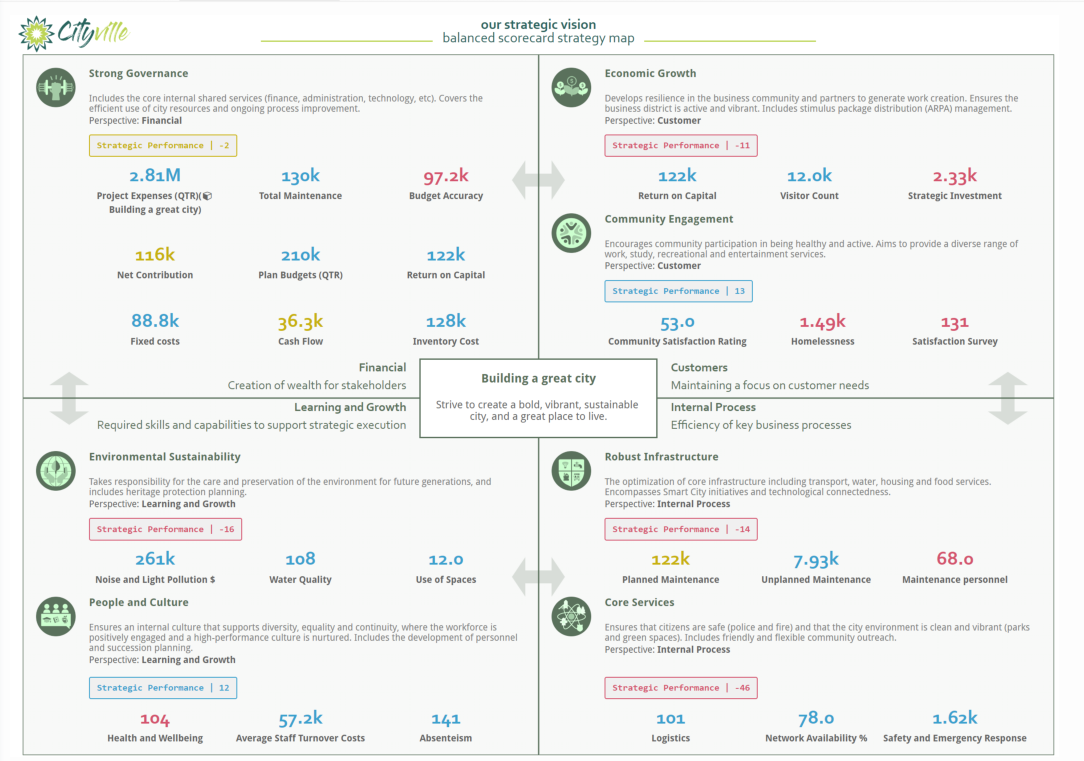
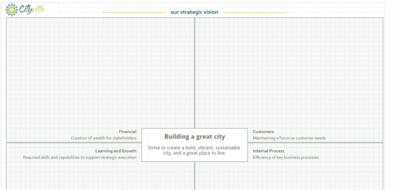
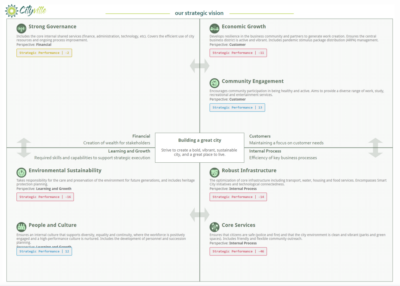
A good BSC strategy map preserves the classic 4 quadrant view and I want to ensure that there is plenty of room for growth and adequate padding (white space) around dashboard objects – the intention is to always ensure it is easy to understand and not an assault on the eyes! I added the vision and mission block right in the center with descriptions of the perspectives in each quadrant.
> Time taken: 20 minutes
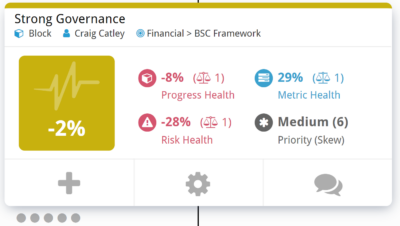
Step 5 – Adding the Dashboard Objects
Starting with outcomes (deliverable activity described within blocks), I need to start organizing the objects within each perspective quadrant. I want to make sure that outcome metrics are clearly aligned with output goals to ensure there is no visual confusion.
> Time taken: 45 minutes
Step 6 – Make it Beautiful
The final design step is often the longest. I want to make sure everything is symmetrical and balanced on the canvas, using object layering, arrow keys for fine tuning, and snap-to canvas grid lines certainly helps. I added arrows using shape objects to give a sense of relationship between perspectives and some icons using image objects to give the report some personality.
> Time taken: 60 minutes
Step 7 – Sharing and Collaboration
Finally I need to pass ownership and share the dashboard with my colleague. Again, this is very straightforward in StrategyBlocks by switching the dashboard to “public”, giving viewer rights to members of our team and giving ownership rights to the client representative.
> Time taken: 1 minute
So how long did the whole process take? Almost exactly 2.5 hours starting from nothing to create a live balanced scorecard strategy map dashboard, that will always be refreshed with live data and automatically shared across the enterprise.
I hope this helps with your dashboard creation. If you would like to go through our Dashboard Workshop please feel free to book one here.
Leave A Comment