
Let’s see this example. The orange line is the target which rolls up the same as the progress %, so we can use that for these examples. The blocks below all start Oct 1.
ROLLUP PARENT ends Dec 31.
CHILD A ends Oct 31.
CHILD B end Nov 30.
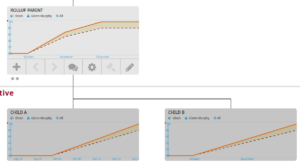
This is the progress chart view in the blocks tree. The lines before October are all 0. Once we hit Oct1, we start expecting progress at a linear rate in the child (e.g., a straight line from 0 to 100% over the duration of the block). The parent’s line is based on the children’s target-lines and the rollup setting. In this case we’re using duration rollup (default rollup).
Child A is 1 month, and Child B is two months, so this means A contributes 1/3 months to the ROLLUP PARENT (P) (33%) and B contributes 2/3 months (66%) to P‘s progress. On Oct 31 we expect 100% of A (33%) and 50% of B (66/2: 33%). This means that P expects 66% on Oct 31. The remaining 33% is required from B on Nov 30. Even though P goes to Dec 31, it’s target is 100% for the all of DEC.
Now let’s see what happens when we change the rollup to “custom weight”. (we would have the same picture as above if we said A had a custom weight of 30 and B was 60, since duration is weighted based on the number of days). Anyway:
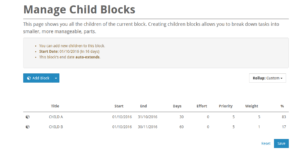
A is 5, and B is 1.
Here’s what the charts look like now:
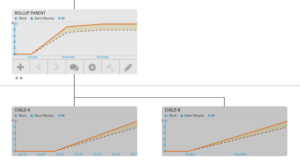
Child A: now contributes 5 (out of 6), and is due on Oct 31. This means it’s adding 83.3% on Oct 31.
Child B: now contributes 1 (out of 6). On Oct 31, it’s expected to be 50% complete. (1/6: 16.6%, so 8.3% is half that. )
83.3 + 8.3 = 91.6% due on Oct 31.
The remaining 8.3% is due on Nov 30.
Basically all the rollups behave the same way. Duration just means # of days.
Leave A Comment