
Strategic Dashboards in StrategyBlocks
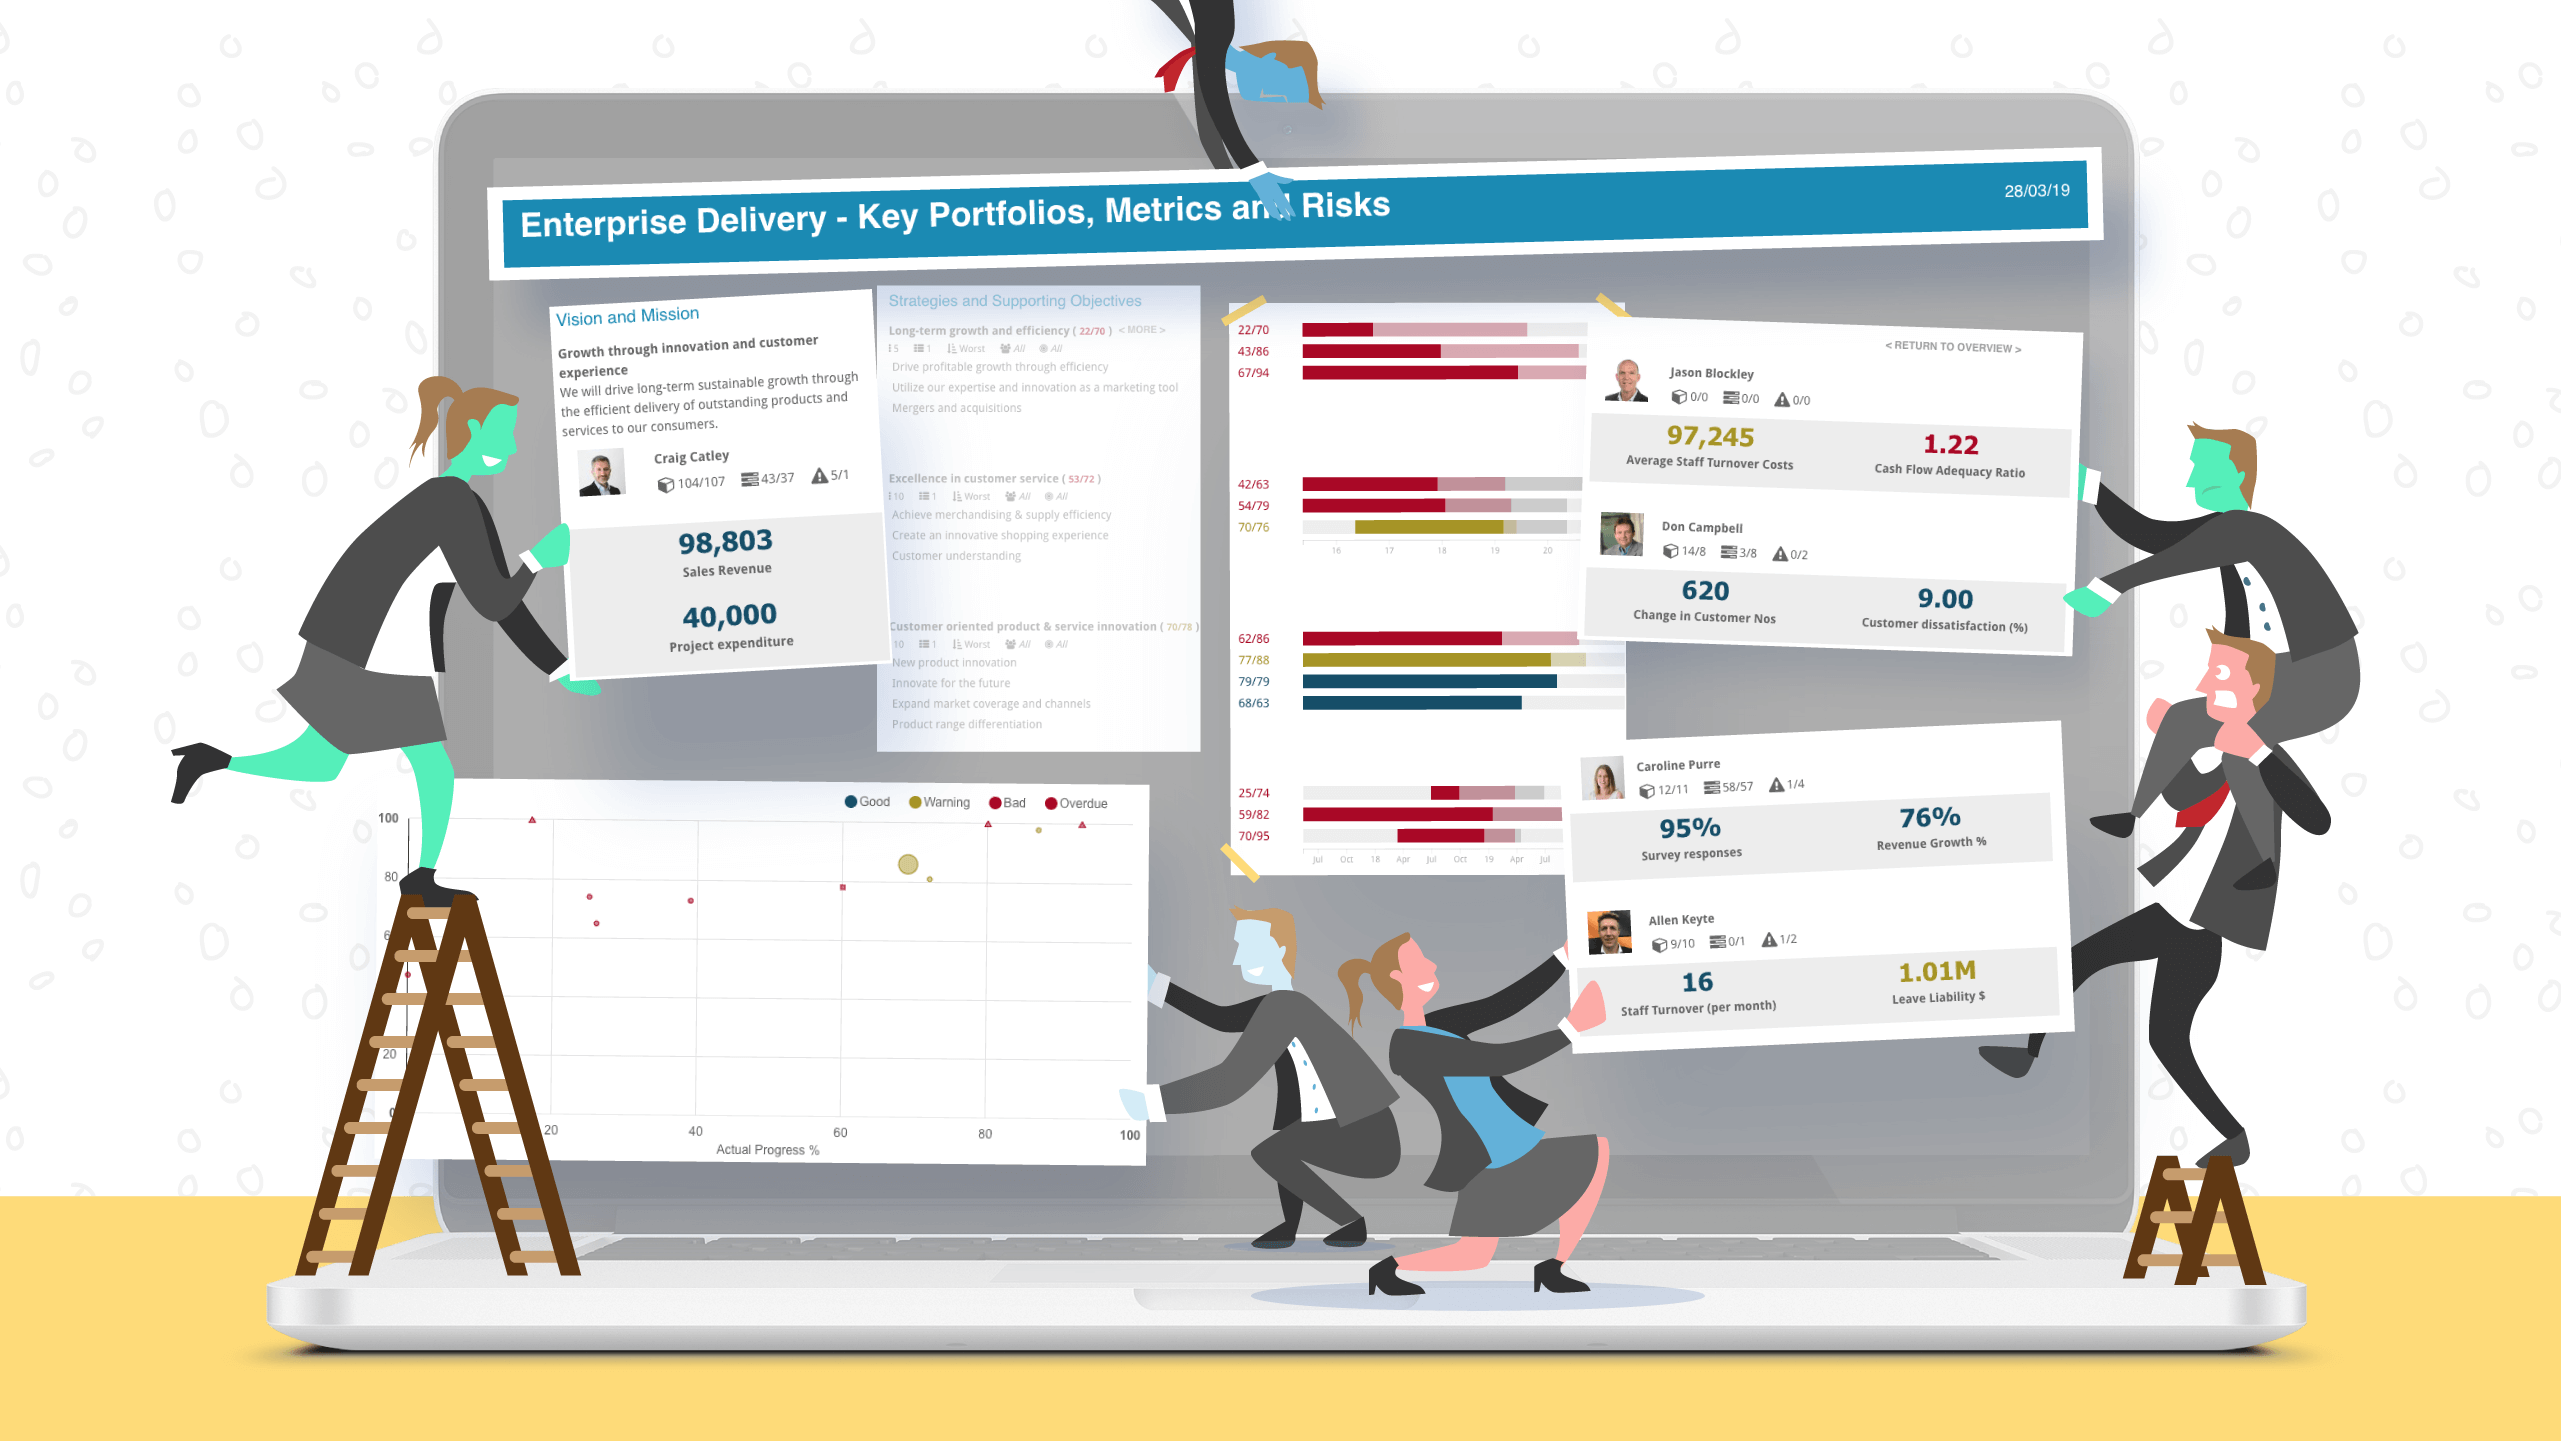
The strategic plan has been created and modelled: you know what you need to do, by when, and who is accountable for its delivery. Now you need to track the organization’s progress towards its strategic goals – you need to monitor the quality of your strategic execution quickly and easily. StrategyBlocks’s custom dashboard capability enables you to quickly develop custom views of the critical success factors that your vision depends on. In this blog I’ll describe how strategic dashboards can help all parts of the organization track their contribution to the journey and what to think about when starting with a blank dashboard canvas!
First Things First – Know Your Audience
When designing any sort of dashboard, you’ll need to understand your audience. A strategic dashboard is a tool for monitoring the long-term success of the company strategy with the help of critical success factors. Yes, by its very nature it is a high level view of progress over time, but that doesn’t mean it’s just for the executive board. Each team, department, or business unit has its part to play in the organization’s journey and StrategyBlocks allows you to quickly build multiple dashboards, each tailored to the goals of your intended audience and linked when appropriate.
Critical Success Factors – Not Just KPIs!
Strategic dashboards, unlike their operational and analytical cousins, are not just about numeric key performance indicators. Critical success factors for successfully delivering your strategy include measures of progress and completion as well as visibility or risks that could knock you off course. One part of your plan might be focussed on project delivery whilst another might be key to meeting your financial targets so show what’s relevant on your dashboards.
Think Outside the Box for Metrics
Key performance indicators (Metrics in StrategyBlocks) will always have their place on strategic dashboards, but don’t restrict these to traditional financial measures. For example, a customer service team might want to see customer satisfaction scores and number of complaints on their dashboard. And don’t forget tracking strategy engagement within your organization too! I’ll follow up with another blog on techniques for this later.
Good Design Principles Still Apply!
A strategic dashboard should follow the same best-practice design principles as any other dashboard: avoid unnecessary clutter – keep it easy on the eye with enough white space, group content logically, don’t distract with too much data – for example, limit charts to relevant time periods and not too many colors. I’ll leave a discussion on dashboard objects in StrategyBlocks to another day. In the meantime, happy dashboarding!
Leave A Comment